Showing posts with label Google Earth. Show all posts

Wednesday, April 15, 2020

Metsiphi (C6878)


The area of Euboea south of Styra is a wild forested country of zig-zagging ridges.  It was not densely populated at any period in antiquity and it remains sparsely populated today.    I've been adding find sites in this area to the Mycenaean Atlas by integrating Fachard [2012] and this brought me to an habitation site called Metsiphi.

The site of Metsiphi (no. 4 on the next map) consists of a six-room building and a boundary stone marking the border between the demes of Eretria and Styra.  It may be a construction of either the Archaic or the Classical period.


Where is it?

I was able to locate two sets of directions to this site.  The map above should help you in following them.  And, in order to make better sense out of the geography I include some place name definitions (marked with an asterisk in this text, thus Kiapha Pass*) in a glossary appended to this post.

Fachard [2012] gives these directions to Metsiphi:

“From the Kiapha* pass, located some 300 m north of the gate of the Venetian castle of Larmena*, you can follow an (ancient?) path towards the valley of Aghios Ioannis. About 1 km east of the pass, there is an old building and a rock monument, both discovered by N. K. Moutsopoulos.”(1)


The town of Styra, in southern Euboea, lies just to the north of a long mountainous ridge (Kliosi*) that runs north-east to south-west across the entire length of the island. There is a classical period fort (sometimes referred to as the Acropolis of Styra*, F5701) on this ridge and immediately to its east the Venetian castle of Larmena*(Armena*, F5654).   That would put the pass (col) at F5694 where there does indeed appear to be a saddle over the ridge of Haghios Nikolaos. In Google Earth I drew a circle of 1000 m. radius and centered it on this pass.  But without any specific thing to look for the chances of seeing an overgrown ruin in GE are basically zero. And, as for the toponym of 'Haghios Ioannis', it is undiscoverable on any map to which I have access.

What to do?


I found another source which gives directions to Metsiphi. In Reber [2002] we read the following:

"In antiquity, two different routes led from Styra to Karystos. One corresponded roughly to the course of today's road, the other led first from Styra to the east and then followed the gentle slope of the northern slope of the Kliosi*. Via a saddle east of the fortifications one first came into a gorge and from there via a low saddle into the wide valley of Stoupaioi. From Stoupaioi, the path led through the mountains to the south, where it merged with the first path behind the village of Vatisi."(2)

Then he remarks:

"If you follow the path to Stoupaioi, which is partly paved with ancient retaining walls, you will find the ruins of an ancient building, which was uncovered by N.K. Moutsopoulos, below the saddle at Metsiphi." (3)


Karystos itself is at the south end of Euboea (F5697).  Kliosi* is another name for the ridge on which stands the Acropolis of Styra* (F5654).  Stoupaioi is at F5695 and Vatisi is further south at F5696.  And yet we still have no definite narrowing for the location of Metsiphi.  

But as Reber does not specify the starting point these directions do not help. Are we starting from Styra again? From the col (Sattel)?  Just as Reder promised to get specific he starts referring generally to ‘the path to Stoupaioi’. This path is a long one and through wild country; it will not help us to find Metsiphi.

What to do?

Well, it turns out that Reber does provide a photograph of the Metsiphi house in question. Perhaps it’s possible to duplicate that view in Google Earth. Here’s the picture: (4)


The house at Metsiphi.  But which direction are we facing?
I looked at this for a while and I decided that if it were possible to identify the mountain in the background it might be possible to draw a line back from that mountain to the site of Metsiphi.  At this point I really had no hope of locating Metsiphi exactly.

Could this view be replicated in Google Earth?  On my first attempt I came up with this:


It was gratifying to come so close on the first attempt.  It turns out that the  background mountain in this picture is Peristeri (F5693).   But it was clear that I hadn't yet succeeded in finding Metsiphi.  In Reber's original there is a ridge in the right center which is of lighter color than its surroundings.  That ridge does not appear in my reconstruction.  I continued to rotate the image in Google Earth until I had this:


In this view 1  indicates the pale colored slope which appears also in Reber's picture.  2 is the Peristeri peak. 3 indicates the slope down from the left which is also in Reber's picture.

We're obviously very close to Metsiphi at this point.  Can we find it by searching around this point?  Not likely, but first let's see what we're looking for.  Here's the floor plan of this building as supplied by Reber:

Floor plan of Metsiphi house from Reber [2002] 46, Abb. 3.

I started to search in this area and in no time I found this:


And zooming in:


In this version I did a find-edges in Photoshop and then multiplied it against the picture layer.  To say that I was astonished when I saw that grid shape is an understatement.  This is a difficult country.  I'd been looking for an entire day with absolutely no expectation of finding the exact site but suddenly there it was.

And one last mystery to clear up:  What or where is the valley of Aghios Ioannis?

The valley of Aghios Ioannis is just the light-colored ridge which appears at the right center of Reber's original photograph.  It is just to the south and west of Metsiphi.  Here is a view of it from the air (N at the top):


Google marks a church here which it calls Haghios Ioannis (F5698).  The area to the left was probably cultivated in ancient times.  

About Metsiphi Fachard says 
'The most probable hypothesis seems to us to be that of a farm exploiting the little valley of Haghios Ioannis."(5)

Here's my final reconstruction of Reber's photo as taken from Metsiphi itself (foreground):


... with Reber's photo again for comparison:


Metsiphi is C6878 in the Mycenaean Atlas.  Its coordinates are 38.147513 N, 24.278 E

And a final map with everything labelled:


1. Styra
2. Haghios Nikolaos (Acropolis of Styra AND Fortress of Larmena/Armena)
2a. Kiapha Pass (col, Sattel)
3. Koryphi peak (682 m)
4. Metsiphi and Haghios Ioannis


The reproduction of landscape views in Google earth is a good technique that I have used successfully many times in the past and I encourage you who are trying to locate sites from photographs to try it.

Glossary of Place Names at Haghios Nikolaos ridge:

I used the following geographic terms in the specific way explained here:

The term 'Haghios Nikolaos' (sometimes 'Diakofti') is reserved in this post for the small plateau at the west end of the Kliosi massif, elev. 648 m ( 38.146118° N,  24.262697° E).  It is right at the ridge-line and overlooks a small pass (called by Fachard [2012] the Kiapha Pass, F5694) just a few meters to the NE.  This plateau takes its name from a nearby chapel cut into the rock just off to the west and named for Haghios Nikolaos.  Do not confuse this chapel with the church dedicated to the Virgin (F5700, another Panaghia?), placed prominently at the center of this plateau.

In this post the name 'Armena' (also 'Larmena' and with numerous alternate names and transliterations; F5654) is reserved for the great 13th century walled stronghold located on Haghios Nikolaos.  This corresponds to Fachard [2012] 229, no. 170, 'Aghios Nikolaos: Château-Fort d'Armena'.

Just to the W of the fortress of Armena, and adjoining it, was located a classical period fortress (in Fachard [2012] 225, no. 169) of which some walls and a famous and often photographed gate are the principal remains.  There is a plan of the remains of this specific fort in Fachard Fig. 190.  Photographs of the gate are in Reber [2002], Taf. 10, nos. 2 and 3.  A very helpful map of both the classical fortress and the Armena fortress is given in Ducrey et al. [2005], 121, fig. 4.  This classical period fortress is often referred to as 'The Acropolis of Styra' (F5701) and I have used that name for convenience but Reber [2002] 44 casts doubt on the idea that it could have had such a purpose given its great distance (~ 2 km.) from that city and therefore this appellation should be used with caution.  Fachard [2012] calls this classical period fortress 'Aghios Nikolaos' (6) but I have reserved that name as the geographic designator of the entire plateau.

The term 'Koryphi' ('Korifi'), alt. 682 m. is reserved for the peak of the Kliosi mountain ridge located about 1700 m to the NW of 'Haghios Nikolaos' at 38.160292° N, 24.279566° E.  Here it is given the feature name  F5699.

The Kliosi range (often referred to as a single mountain) is a long ridge that begins at the north-east of our area and runs to the south-west for about 15 km.  One of its high-points is Koryphi at 682 m asl.  Another is Haghios Nikolaos itself at 648 m asl.

Footnotes

(1) Fachard [2012] 336, no. 171. “Du col de Kiapha, situé à quelque 300 m au nord de la porte du château vénitien de Larmena, on peut suivre un chemin (antique ?) en direction du vallon d’Aghios Ioannis. À environ 1 km à l’est du col, on remarque une construction ancienne et une borne rupestre, toutes deux découvertes par N. K. Moutsopoulos.”

(2) Reber [2002] 45. “Von Styra aus führten in der Antike zwei verschiedene Wege nach Karystos. Der eine entsprach ungefahr dem Verlauf der heutigen Strasse, der andere führte von Styra zuerst nach Osten und folgte danach in leichtem Anstieg dem Nordhang des Kliosi. Uber einen Sattel ostlich der Befestigungsanlage gelangte man zuerst in eine Schlucht und von dort uber einen niedrigen Sattel in das weite Tal von Stoupaioi. Von Stoupaioi führte der Weg durch das Gebirge nach Süden, wo er sich hinter dem Dorf Vatisi mit dem zuerst genannten Weg vereinigte.”


(3) Idem. “Folgt man dem streckenweise mit antiken Stützmauern befestigten Weg nach Stoupaioi, so trifft man unterhalb des Sattels bei der Stelle Metsiphi auf die Ruinen eines antiken Gebaudes, das von N. K. Moutsopoulos freigelegt worden ist.”

(4) In Reber [2002] Plate 11.1

(5) Fachard [2012] 336: "L’hypothèse d’une ferme exploitant le petit vallon d’Aghios Ioannis nous semble la plus vraisemblable." 

(6) Fachard [2012] 169, 'Aghios Nikolaos: Forteresse; 169; ... '.

BIBLIO

Ducrey et al. [2005]:  Ducrey, Pierre and Sylvian Fachard, Thierry Theurillat, 'Les Activités de l'École Suisse d'Archéologie en Grèce 2004',  Antike Kunst (48) 112-123. 2005.   Online here.

Fachard [2012]: Fachard, Sylvian La Défense du Territoire; Étude de la Chôra Érétrienne et de ses Fortifications, École suisse d'archéologie en Grèce, InFolio Editions, CH-Gollion.  2012.  Online here.

Reber [2002]: Reber, Karl 'Die Südgrenze des Territoriums von Eretria (Euböa)' Antike Kunst (45) 40-54. 2002 Online here.


Wednesday, January 24, 2018

The Magoula of Aghia Paraskevi

Finding a magoula can be tricky.  There is a good site for the magoulas of Thessaly and I strongly recommend it.[1]

Outside Thessaly, however, and unless the magoula has set of nice clear archaeological trenches on top of it, you have a difficult task.  No matter how imposing it may be in person, so to speak,  on Google Earth it fades into the surroundings.  Its two or three metre rise renders it nearly invisible.

Case in  point, Simpson's "C 58 Ayia Paraskevi: Ayia Marina" which I call C1600.

Here's what Simpson says:

"The "low mound" site of Ayia Marina lies on the north side of the Kephissos river, about 1.5 km. northeast of Ayia Paraskevi (formerly the Kalyvia of Agia Marina).  The site is not large (about 120 m. east to west by 100 m.), but trial excavations here established a long history of occupation, perhaps continuous from the Neolithic.  ... Some Mycenaean pottery was found.  It remains unpublished ... (etc.)"[2]

So.  Not really very important but let's find it anyway.  I include here a series of maps that allow us to zoom in on that area.  From furthest out they are:


In this map we're looking at a large section of eastern Boeotia.  I've circled the nearest biggish town to our magoula.  You can just about see that it reads 'Kato Tithoreia'.


In this second map we've zoomed in on Kato Tithoreia.  The mountain mass to the lower left is the north edge of the Parnassos massif.  I circled the town of Aghia Paraskevi as the closest small town to the magoula.


In this third map we've zoomed in even more.  The town of Aghia Paraskevi is at the lower center and the red circle surrounds the general area of the magoula.  Togoguide (from which these maps come) has even helpfully labelled this area 'Prehistoric Ceramic'.  So we've got to be close.  In every other way it agrees with Simpson's directions.

But can we find the magoula exactly?  It can't be seen in Google Earth.  What to do?

I was wondering about all this when there came to hand a copy of Livieratou [2006] in which the sites in Phokis and Lokris are discussed.  And there, on p. 111 was a full-color photograph of that very magoula taken from the south.[3]  Here it is:


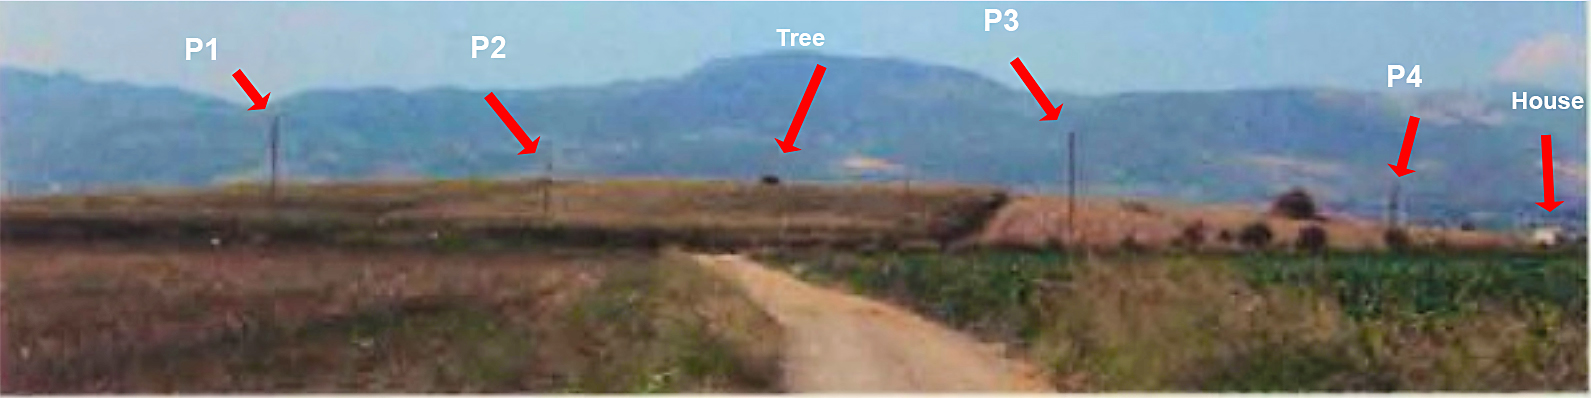
Ooof!  Not very good although I can tell you that it is much repaired over what it was.  Actually the photograph doesn't provide very much in the way of identifying information at all.  A mountain outline, a road, a rise, some telephone poles.  It's a kind of photographic haiku.

I went through, numbering the telephone poles and whatever other features I could pick out.  I took a good look at the outline of the mountain range to the N.  And I also took a very good look at that road in the foreground.  It might just be possible to find that road since we know what to look for.  Anyway, the result of my analysis produced this:


This shows the result of analysis.  I numbered the telephone poles from P1 to P4 and I was also able to identify a house at the extreme right edge and a tree growing on top of the magoula. 

Can we find those things in Google Earth?

I think so.  This is what I was able to do.


At the bottom center of this Google screen shot I put a push pin at the point from which I think the photograph was taken.  It's labelled 'Observer' and its coordinates are 38.594343  N, 22.750459 E.

If you want to follow this example you should get into Google Earth and try to find those telephone poles.  They're very hard to make out.  I may not have matched them up correctly but I think that they're correct.  The center of the magoula is at the blue marker.  I make it to be  38.595921° N, 22.750690° E.

O.k., you say.  'It looks like a rise in the ground but how do you know that there's really a rise there?  Maybe this is just normal fluctuation in Google Earth's representation?'

There's one last thing that we can do.  Google Earth provides a view shed feature.  From any point GE will indicate all the areas that can be seen from that point.  What happens when I invoke the view shed feature from the hypothetical observer's point of view?

I went ahead and did that and the results are as follows:


This is like the previous photo but with the view shed indicated in green.  Everything in green can be seen from the observer's view point which is at the bottom center of the screen.  Sure enough the rise in the foreground blocks out everything beyond until we reach the mountains.  Just as in Livieratou's photo with which you should compare this.

QED.

Updated 1/24/2018, evening.

If you look in the letters section you'll see that Anonymous encourages me to set the vertical exaggeration factor to 3 in order to magnify the vertical differences and make the smaller rises easier to spot.     Anonymous is right.  Manipulating the VE can often be incredibly helpful.   In fact I’m constantly going back and forth between 1 and 3 on the vertical exaggeration control.  But despite that I’m not convinced that setting the VE to 3 in this case gives us any unambiguous evidence.

Here’s a trick that I also like to use.

Click on the path control and then draw several path lines directly over the feature you’re trying to learn more about.  I show a path here that is an example of what I mean.  The location is the same as in the post, C1600.


The blue paddle here marks what I think is the center of the magoula.  Once you’ve drawn this multi-segment path put your mouse pointer on one of the segments and click on the right mouse button.  This will pop down a menu.  Click on the second choice from the end: ‘Show Elevation Profile’.


When you do that GE puts up a display that shows the heights for every point on the line.  


If the line you drew doubles back on itself the appearance of the elevation profile is vaguely periodic.  That just means that heights and depths are more strongly pronounced and seem to reflect each other.  It’s like taking slices out of the magoula.  You can quickly see where the high and low points are and how different they are from each other.  GE also shows you the maximum height; here 142 m. – and the low which is about 135 m.  This is a difference of seven m. or about 22 feet.   Sounds about right for our magoula.   It turns out that the high point is about where I thought it was.  Remember that the heights shown are only along the figure you drew.  It amounts to an elevation sampling.  

You might do this several different times with different paths before you decide what’s what.

You can also do this in GE with circles or just simple straight lines.  But I find that the multi-segment path is very useful.  This is a powerful technique and I urge all of you to experiment with it.

Mycenaean Atlas Project.

For the Mycenaean Atlas Project DB release 50 has been delivered.  It substantially completes the integration of some 400 sites whose locational information was furnished through the generosity of Dr. Alex Knodell of Carleton College.

If anyone has corrections, additions, doubts, etc. about anything on the website then please send them to bobconsoli 'at' gmail.com

Here at MAP we always want to hear from people.  Follow me on Twitter (@squinchpix) and on Google Plus (Robert Consoli).  Please do it.  I need your support!

Friends don't let friends use Facebook.


Notes

[1] The Innovative Geophysical Approaches for the Study of Early Agricultural Villages of Neolithic Thessaly whose website is here.

[2] Simpson [1981], 79.

[3] Livieratou [2006] 111.


Bibliography

Livieratou [2006]: Livieratou, Antonia   After the palace and before the polis: study cases from the centre and the periphery; The transition from the Late Bronze to the Early Iron Age in the Argolid and Central Greece (Phokis - East Lokris), Vol. 1, Dissertation for the Degree of Doctor of Philosophy, The University of Edinburgh, 2006.  It is online here.

Simpson[1981]: Simpson, Richard Hope. Mycenaean Greece. Park Ridge, New Jersey: Noyes Press, 1981.


Tuesday, March 7, 2017

The GIS and the Front End


What is a geographic information system (or GIS)?   In its simplest form a GIS is a software package meant to facilitate the creation and display of maps along with analysis and display of any data that includes lat/lon pairs. 

There are some critical components in a GIS.  A database, for example, along with a ‘front-end’.  O.k. so what is a ‘front end’?  A ‘front-end’ is a software package that interfaces to a database and makes it possible to retrieve data and convert it into a map.  The second thing a ‘front-end’ must do is allow the user to specify geographical points that then get stored in the database for later retrieval/mapping.  In other words a front-end acts to gather and store data in a DB and it also gets data from the DB and displays it as a map or as tables. That’s really all there is to it.

And a GIS can be surprisingly simple.  Google Earth makes a respectable ‘front-end’ but you need to use it in conjunction with a database in order to have anything like full ‘GIS’ functionality. So that although the two parts, Google Earth and The Database, are separate and not automatically interconnecting, you can still use them together even though you store what you retrieve from the database as an intermediate flat file before you then import it into Google Earth.  It looks like this:


I’ve numbered the arcs here for easy reference.  In step 1 we get a lat/lon pair from Google Earth and we attach it to a place name and id with some .sql query like this:

insert into site (
place_key,
name,
lat,
lon,
region)
values (
‘C9999’,
‘Tholos’,
36.7654,
22.4536,
‘Messenia’);

In step 2 we take that .sql statement and enter it into the database.
We repeat steps 1 and 2 as often as we need to in order to generate a database of place marks.  When that’s done we have a table (the ‘site’ table in this case) which holds our data and which was derived from Google Earth. 

Later we want to come back and display the site table on a map.  In step 3 we execute the following query in the database:

select * from site;

…And we save the result as a comma-separated file (or .csv).  A good database, such as MySQL, will allow you to do this. 
In step 4 we import the .csv into Google Earth using GE’s ‘import’ feature (not the ‘open’ feature).  Importing into Google Earth is described here.

And the result is that you now have your data displayed on a map.  Of course you can modify the site table in the meantime, amplify it from different sources, etc., etc.

Once the data is displayed in Google Earth you can also save it as a .kml (.kmz is a .kml in zip-file form).  The .kml is a very useful file type since most GIS products support it.  That deserves a modified picture:


Here, in Step 5, I show the Google Earth capability of exporting either .kml or .kmz files.

And although this method seems a little clunky (because of the hand derivation of .sql statements in step 1 or the intermediate .csv file in steps 3-4) it’s still a perfectly reasonable way to work and, in fact, all the Mycenaean Atlas Project so far, thousands of points, has been implemented in just this way.    Why does this work?  It works because the work of finding points can be very much greater than the relatively trivial operations of hand-entering them into a database.  As long as a project is small or the data entry is a small part of the total cost we don’t need anything more elaborate.


Another method of extracting information from the database (besides extracting flat files from it) is to write custom software for that purpose.  For example, in the Mycenaean Atlas Project the database contains lots of material that you wouldn’t ordinarily display on a map, like bibliographic information.  And yet the bibliographic material supports the rest of the database; it is the warrant, in a sense, for the data’s accuracy.  For that type of material you’d want to generate, not a map, but a report.  For that purpose you could just use sql:

select * from fnb where pk = ‘C237’;   // this query would return bibliographic citations for site ‘C237’.

And sql can be made very elaborate and, ordinarily, .sql queries can work for this purpose perfectly well.

But let’s say that you want to dump, in a nicely formatted form (not just a table), all the bibliographic material and show its connections to the rest of the DB.  For that purpose simple sql might not do so well.  

 For writing a fancy report you need to write a program.  I expand our diagram to show that possibility.


Here I show a software interface connecting to the database and generating (in arc 6) a text report of some kind.  There are several good software interpreters that make connecting to the DB simple.  The PHP language is a reasonable choice.  It is very widely used in Internet applications to serve a site’s online database.  In fact, if we were to put the Mycenaean Atlas Project online the Text Report attached to arc 6 would actually consist of .html pages.  To download your free, widely-used, standard version of PHP just click here. 


The Mycenaean Atlas Project actually does use a couple of self-developed programs in PHP in order to generate full reports of nearly the entire contents of the database.  (These reports are in .pdf form, and they're yours for the asking).  The first is a complete report on all the Bronze Age sites; the second is a complete dump of the Features table.  (The Features table consists of non-Bronze Age sites which are mentioned in the gazetteer and other literature and which you need to know about in order to make sense of that literature.  ‘Features’ include towns, signs, churches, monasteries, regions, chapels, streams, bridges, etc. etc.)  

By way of parenthesis there is a .php class that allows you to build .pdfs directly.  Find it described here.  

What I've shown so far is a little over-elaborate. 

To simplify things we can get ourselves a front-end that can interface directly to the database and by eliminating the hand written .sql statements as well as the intermediate .csv file.  After all, once we’ve finished with hand-created .sql files and db-generated .csv files we don’t want them hanging around.  The Truth Model is in the Database and in the Database only.  The .sql and .csv files must be trashed once they’re used so as not to lead to confusion.

What front-end interfaces directly to the DB?

A correspondent of mine from Cambridge, England, shares that he is working on a project to map Bronze Age burial sites using QGIS as his Geographic Information System.


What is QGIS?  QGIS is a genuine, full-featured GIS that replaces nearly all the complicated stuff I’ve presented so far.  I’ll discuss it soon in a separate blog post.

~~~~~~~~~~~~~~~~

Anyone who would like to have a copy of the MAP database can send an e-mail to bobconsoli 'at' gmail.com or leave a comment on any of my posts.  To run the MAP database requires a SQL server running on your desktop computer.   MySQL is such a server and it is powerful, industry-standard, and free.  

I can and will make .kml or .kmz files, which can be opened directly in Google Earth, available to those who would like them.  
I can also create .csv files for people who would like to import Mycenaean Atlas Project data into Google Earth but would like it in tabular form.
Those who do not have a SQL server but would like the full database in .pdf form can have that for the asking.

If you like these posts then please follow me on Twitter (Squinchpix) or on Google+   (Robert Consoli)

Facebook?  Sorry.I.just.can't.

Saturday, January 7, 2017

Accuracy vs. Precision in the M.A.P.


"You're traveling through another dimension, 
a dimension not only of sight and sound but of mind. 
A journey into a wondrous land whose boundaries 
are that of imagination. That's the signpost up 
ahead - your next stop, the Twilight Zone."
Rod Serling


In a recent post I talked a little about how precise ideal lat/lon pairs are.  One thing I said was that a measurement to one one-millionth of a degree resolves to about four inches in latitude and longitude (4.4 in. in latitude equals 11.176 cm).  Any system that provides measurements like that is said to have a precision of one one millionth of a degree.   In that discussion I ignored the difference between accuracy and precision.  The lat/Lon pairs I provide from Google Earth have a precision of one one-millionth of a degree.  But there’s the additional question of Google’s accuracy.  Imagine that Google Earth was a giant machine for producing lat/lon pairs.   How accurate are those pairs when they come out of the machine? How close do these pairs come to an idealized model of the earth?  Do Google's numbers accuracy match their precision of representation? No.  It appears that they don't.

This is the same as asking how well Google has fitted its source photography to an ideal representation of the earth.  Do the photographs match the ideal grid of the earth itself?  This is a question worth asking because many operations have to be performed on the aerial photography before it’s presented on-line.

For a brief tour of orthorectification issues see this. In this study the authors checked how well Google's lat/lon pairs matched up with lat/lon pairs from a verified data set. The whole article is worth reading. Their conclusion?

"Using accurate field and photogrammetric measurements (extracted from a cadastral database) as the reference dataset and comparing them against well-defined and inferred locations (CPs) in GE’s medium and high resolution imagery, the estimated horizontal positional accuracy of GE’s imagery over rural areas (5.0 m RMSEr) was found to meet the horizontal accuracy requirements of the ASPRS (1990) for the production of “Class 1” 1:20,000 maps. "[1]

The RMSEr is an estimator of the standard deviation based on model results.  So you could, as a rule of thumb, think of 5 m. as the standard deviation of Google's modeling error.  This would mean that 68% of the time the Google lat/lon pair is within 5 m. of the actual position of the sought-after object and about 32% of the time it's further away than 5 m.

But the authors also add some cautions:

"However, the results also suggest that this accuracy requirement might not be met for rural areas if coordinates are extracted only from GE’s medium resolution imagery or from imagery collected before 2008. Furthermore, despite the results presented here, GE’s imagery should be used with caution due to the presence of large georegistration errors in both GE’s medium and high resolution imagery."[2]

In other words we are being warned against actual positioning and alignment errors in Google Earth's images. This can be easily seen if you pick a specific feature on an image and then drop a marker on it for each of Google's available images at that location. Let's look at an example. Here we have a church in Messenia called the Panagia (37.033444°, 21.737154°). If you look into the field across the road you see a circular field feature (I think that it's a well).


I brought up the 'Show historical imagery' slider and marked that well on each layer. The result was this:

Positions of a field feature based on four different available images in Google Earth
Here we see that the field feature (along with everything else) appears to drift and to appear to be associated to different lat/lon pairs depending on the date. The radius of the circle which includes them all is 11.32 meters. So, there's some surprising drift in Google's image alignments. Not fatal but something to take account of.


And just to emphasize what's going on I also show just the image from the May 20, 2003 plate:

Here the entire image has 'drifted' under the markers (which are fixed) until the
5/20/2003 marker is over the field feature.  Notice the displacement of the 'Panagia' label
which should be over the right-side building on the upper left.  This label is displaced nearly
22 m. from where it started.


So there are several potential sources of error in my DB lat/lon.  The first is the degree of Google’s fidelity to an underlying model of the earth's surface, the second consists of Google's alignment of its images. I should just wrap this up by saying that even though GE provides measurements with a precision of 10^(-6) or one one-millionth of a degree (i.e. about 4 inches) the accuracy it provides is, perhaps, a little better than 10⌃(-4) or one ten-thousandth of a degree which at 37 degrees north latitude is about 353 inches (8.96 meters). And this does not take into account imagery offsets.

The third kind of error is the error I introduce when I choose a lat/lon pair to represent a gazetteer entry.

For my general concept of my own 'Introduced' error let's say that we were looking for the field feature mentioned above (the well) and I had only this (entirely made-up) written description as to its whereabouts:

"The church of the Panagia is a kilometer or so to the northeast of the town of Myrsinochori. About 20 or 30 m. to the east of the driveway leading to the church there is a field feature which consists of a stone circle. It is about 10 m. south of the road ..."

Now, given that I could find the Church of the Panagia at all (it is 1200+ m. in a straight line from the northeast edge of Myrsinochori to the church and nearer 1500 m. by road) I would proceed to follow the directions and mark my field feature in good faith like this (I'm pretending that I can't actually see the feature in GE):


In this map the 'H Line' is 25 m. in length (halfway between 'twenty or thirty' meters).  The 'V Line' is 10 m. in length.  After having drawn both those lines (and, I emphasize, based on the written description) I would put a marker at the S end of the vertical line and advertise the lat/lon pair of that push pin as the location of the sought-for feature.  If I had really proceeded like this I might very well feel that my mark was within ten meters of the real feature.  And I would associate my lat/lon pair (at the yellow push-pin) with an introduced error term of ten meters.  In this case I drew a circle with a ten meter radius centered at the push pin.  This circle does, indeed, touch the field feature I'm trying to mark. 

This introduced error term is intended to reflect how well I think I’ve located the object of interest.  I have defined this error term as the radius of a circle, in meters, centered exactly at my lat/lon pair and which covers some part of the sought-for feature.   For example, if the feature can actually be seen in GE then I mark the feature and set the error term to zero.  In that case the "real" error is reduced simply to Google’s accuracy at that point. Given that the features are of various types a non-zero introduced error radius has several possible meanings.  If my introduced error term is ten then, finding yourself exactly at my lat Lon pair means that you are distant from the object by, at most, 10 meters plus Google’s error.  If Google’s error term is 5 meters then, in the worst case, you are fifteen meters away from the goal.  At best the two errors would offset and you would be 5 meters from your goal.

If I can’t see the feature but the description is constrained in some way, a cave opening or a narrow hill- or ridge-top, then I set the introduced error radius to 10, 20, or perhaps even fifty meters.  When the directions available to me are imprecise but I know generally where the feature “ought to be” then I’ll set the error radius to one hundred or two hundred meters. A feature on a "hill-side" would be the classic example.  Sometimes directions to a small site or find are described as being in a certain town.  In such a case, and with no additional info, I will put a marker on the town but set the error term to ‘N’ or ‘unknown’.   I hope it's clear, from the foregoing, that these introduced error radii are subjective only.  They are merely my opinion about how well I did after taking everything into account.  Of course, they’re not fixed in stone, either.  If I rethink an area or if I receive more accurate information from someone who’s been there then the error term can be driven to zero.  In that sense they’re simply a progress report of accuracy; ultimately my introduced error radii should all be driven to 0.

Remember that even small introduced error radii can specify very large areas.  An error radius of ten meters describes a circle with an area of 314 square meters or 3379.0 square feet which is about half the size of the average house lot.  In my DB that’s the best non-zero case.  A 20 meter radius specifies a circle with an area of about 1256 sq m. or 13519 square feet.  This is about the size of two average house lots.  A 30 meter radius specifies a circle of about 2827 sq m.  A fifty m radius a circle of about 7853 sq m.  If the error radius is 100 m then you should  imagine  a circle with the radius of a football field.  On rocky and rugged terrain (not unknown in Greece) such an object is still lost.  On flat terrain (the golf course at Pylos comes to mind) such a radius might be feasible.  Much larger than that and you should consider the object is still not found in any useful field sense and you’ll want to do additional research before going out to the field.

Finding something successfully also depends on what you’re looking for.  There’s a huge difference between looking for a plainly visible hilltop fort on the one hand or some area where, long ago, some researcher found a single sherd.  In the first case you may have sloppy and inaccurate directions but that makes no difference because you can see the feature from a kilometer away.  In the second case you may have directions that are accurate and precise; you may reach the exact spot and stand exactly in Richard Hope Simpson’s footprints and still not be confident that you have found the right place because, on the day you’re there, no sherds are visible.  In that case the error term takes on the subtle meaning of extent.  It indicates over how much area I think a reported sherd scatter should extend.  An introduced error term can also be interpreted as a degree of confidence. It can designate the area where I'm most confident of finding the feature but, granted, the desired feature may still be outside the circle.

This raises the question about what my lat/lon pairs are intended to facilitate, anyway.  What are they for?  First of all I hope that they can be of some assistance to students who are reading about the Mycenaean sites and have no prior familiarity with where those sites are.  I hope, also, that this DB can be of help to researchers that are planning to go into the field.  But it’s more than that.  My very strong feeling is that, in the field, and no matter what you find, whether it’s a worn, barely recognizable sherd or a palace complex, Datum One is where the object was found, exactly.    Why is location so important when generations of archaeologists have supposed it to be unimportant?  Location is important because only that can relate your specific find to everything else.  For example, how far is it on the average from a BA habitation to a water source?  What’s the standard deviation of that distance?  What’s the average elevation of a BA settlement, tholos, chamber tomb?  Is the average habitation above or below the average BA cemetery?  What’s the average distance from a habitation to its associated cemetery (when such an association can be determined)?  How many BA habitations do we know that were within 100 m of the ocean?  500 m?  1000 m?  Did the Mycenaeans live in the mountains?  What proportion of BA habitations were obviously maritime in orientation or were not so oriented?  How many habitations with a LHIIIB2 burn layer are there and how are they distributed, exactly?   How about some accurate and useful maps of all those variables?  

All of the foregoing questions are quantitative questions/problems/techniques and none of them can be answered without accurate locations, and not only that but accurate locations for every object site in the field of study.  In this respect, at least, every sherd is the equal in significance to every megaron.

Here's a practical example.  Earlier this year Dr. Michael Galaty sent me the URL for an article that he and his colleagues had written about Mycenaean civilization's place in the World System.  The article is here.  It is a very interesting article; part of its method is to calculate slopes around various Mycenaean locations in Messenia and in the Argolid.  To obtain the slope for a particular place you divide the change in altitude by the change in distance over which the altitude is measured.  Slope is really just the tangent of the distances involved; the lower the number the smoother the landscape; the higher the number, the steeper the landscape and when the slope approaches infinity you're dealing with a cliff or something like that.  Part of Dr. Galaty's intention was to show that Messenia and the Argolid differ with respect to the generalized concept of slope in their respective landscapes.  I only bring up his article in order to point out that he and his colleagues had to determine, one by one, the exact positions of the Mycenaean sites in which they were interested.  As he says:

"It was a difficult and time-consuming process to identify sites with the accuracy demanded by Geographic Information Systems (GIS), although Google Earth and Hope Simpson and Dickinson’s Gazetteer were indispensable resources in this regard. As a result, only some of the more important sites are included, and they may not be precisely located in our GIS. Though we did not visit each of them with a Global Positioning System (GPS), we are confident that our GIS database is accurate enough and our results meaningful."[3]  (emphasis is mine)

I intend no criticism of this very useful article.  My feeling is just that it's too bad that Dr. Galaty and his colleagues did not have access to a large accurate database of Mycenaean find spots and, consequently, had to perform a lot of work to create the DB they needed. If they're having this kind of difficulty then everyone in the field must be having the same difficulty.

Mycenology is a science.  Experiments in science have to be repeatable.  The definition of repeatable also includes, at a minimum, 'locatable'.

Let's get Mycenology out of the Twilight Zone.


~~~


If you like these posts then please follow me on Twitter (Squinchpix) or on Google+   (Robert Consoli)

Anyone who wants a copy of my Mycenaean DB or an importable file to Google Earth with some 4000+ Mycenaean find-spots accurately located just leave a comment here or send me an e-mail at bobconsoli (at) gmail.com

By the way, I've just learned that Hope-Simpson and Dickinson's Gazetteer (1979) to which I've never had access (over $100.00 most places) is for sale, brand-new, by the publishers (Astrom Editions) for about 32 euro.  With shipping it should be around $40.00.  

Update: January 2, 2017:  I've just found that Hope-Simpson/Dickinson Gazetteer is available online through Scribd.  Scribd is a subscription service and I don't subscribe but I was still able to have access to the entire document for some reason.  Maybe you will too.

Notes

[1] Paredes-Hernandez et al. [2013], p. 598.
[2] Idem.
[3] Galaty [2012] 450, 'Landscapes'.

Bibliography

Galaty [2012]: Galaty, Michael L. and William A. Parkinson, Daniel J. Pullen, Rebecca M. Seifried. "Mycenaean-scapes: Geography, Political Economy, and the Eastern Mediterranean World-System", in Physis. L'Environnement Naturel et la Relation Homme-Milieu dans le Monde Égéen Protohistorique, pp. 449-454 and Plates CXXXVII to CXLI. In Actes de la 14e Rencontre égéenne internationale, Paris, Institute National d'Histoire de l'Art (INHA), 11-14 décembre 2012. Edd. Gilles Touchais, Robert Laffineur et Francoise Rougement. 2012. Online here.

Paredes-Hernandez et al. [2013]: Paredes-Hernandez, Cutberto and Wilver Enrique Salinas-Castillo, Francisco Guevara-Cortina, Xicotencatl Martinez-Becerra, "Horizontal Positional Accuracy of Google Earth's Imagery over Rural Areas: A Study Case in Tamaulipas, Mexico", Boletim de Ciências Geodésicas, vol.19 no.4 Curitiba Oct./Dec. 2013. Online here.

Blog Posts Concerning the Isthmian Wall

Since 2023 a number of posts concerning the Isthmian Wall and how we located its remaining segments, have appeared on this blog.  This post ...